
Website Metrics That Matter
Top Content
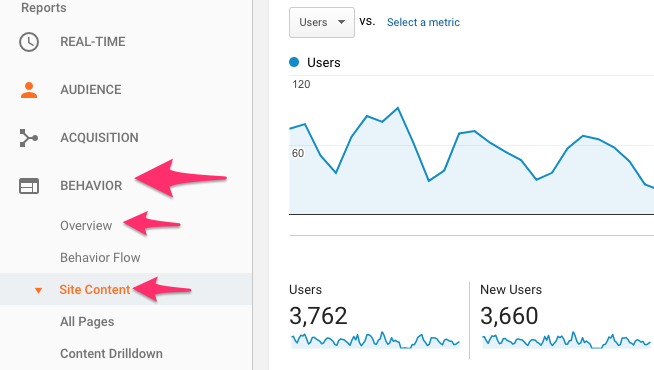
This metric can be found in the Behavior tab of Analytics either on the on the Overview screen or in the Site Content section. It measures how many times the pages of a site are visited in during a given period. You’ll see the pages of the site listed by URI. The URI is the portion of a page’s URL following the domain name; for example, the URI portion of www.three29.com/about-us is “/about-us.”
By reviewing and tracking this data you can see where users are getting the most value from the site. That type of content can then be recreated to theoretically improve the site further. You may also be able to extract what the most popular aspects of the organization are, whether it be a product, location or service.
Top content for a site can also be used to reverse engineer some of the keywords that are driving traffic from search engine optimization efforts.
Total Sessions
A session is the period time a user is actively engaged with your website or mobile app. All usage data (Screen Views, Events, E-commerce, etc.) is associated with a session. The value of this statistic is that it tells you how many times your site is being accessed by users. Its the equivalent of a brick and mortar store counting how many times a customer walks in every day. More importantly, sessions can be used as a measurement tool for other data points such as site pages, devices, and geographic locations. Yoast has a great overview of what exactly sessions are and how that can be used.
Sessions data is found in the Audience tab of Google Analytics in the Overview section as seen below. 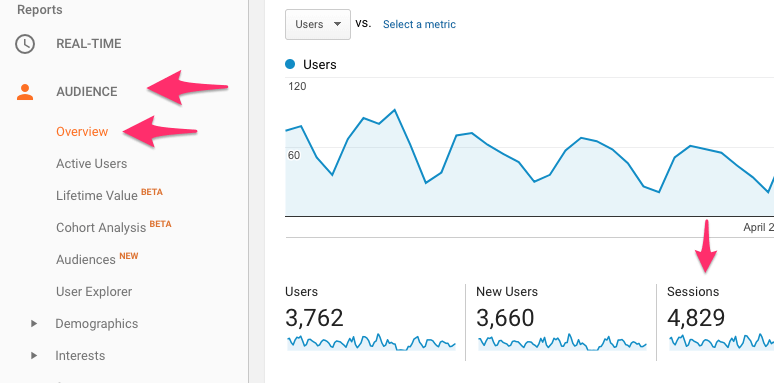
Total Pageviews
Pageviews are the total number of pages viewed either on a whole site or specific piece of it. The “views” counted by this statistic can be made by the same user and can be repeated within a single session. Similar to sessions, pageviews give you an idea of where users are finding value on the site.
Total Pageviews are located under the Audience tab in the Overview section. Just like sessions, they can also be used to compare other aspects of a site. The video below does a nice job of explaining the difference between page views and sessions.
Bounce Rate
A single-page session in which there was no interaction with the page is called a “bounce.” A bounced session has a duration of 0 seconds. The bounce rate tells us what percentage of users land on a site and leave without interacting (or bounce). Bounce rate can also be found under the Audience tab in the Overview section.
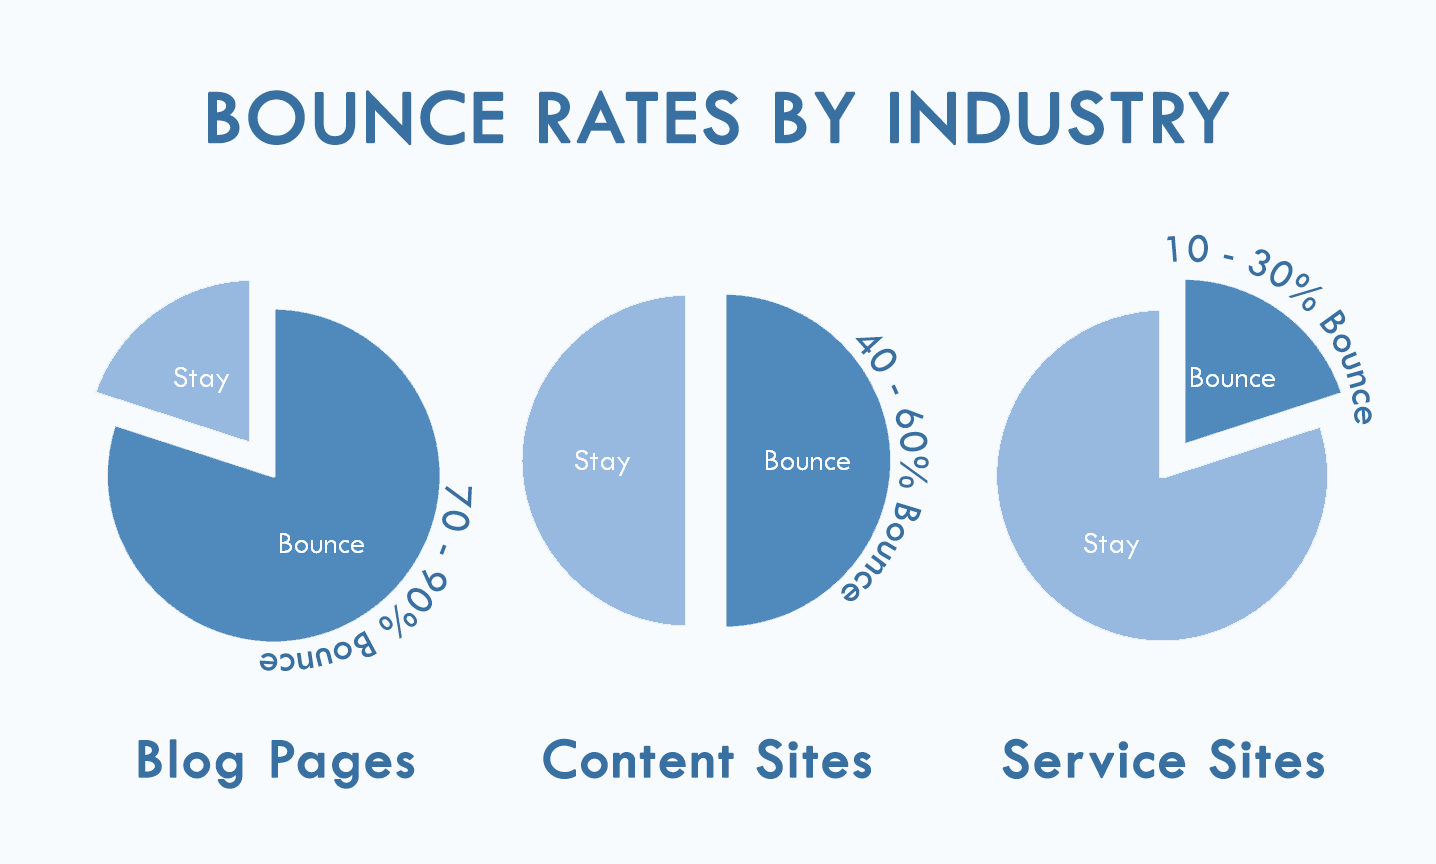
A “good” bounce rate will depend on the industry that you are in and the type of website you have. Below are some guidelines for bounce rates.
Average Session Duration
The Average Session Duration is a measurement of time users are spending on a site. It is also sometimes referred to as Time on Site. A good or bad Average Session Duration will heavily depend on what type of site you are managing. If you have an e-commerce site with only a few products, Session Durations should be short since users are ideally moving through the checkout process quickly. However, if you are running blog, users should be sticking around for a while and reading content. The key is to monitor trends and make sure that the figure is moving in the direction that makes sense.
You can find your Average Sessions Duration under the Audience tab in the Overview section.
Piecing the Data Together
With these 5 main statistics, you can start to gain a picture of what site visitors are doing and adjust accordingly. We feel that they are the best Google Analytics metrics for you to invest time monitoring.
Remember, the data on what users aren’t doing is just as valuable as the data on what they are doing. Many of our clients ask for insight into where their site traffic is coming from. They understand that this is important to ensure they are investing their resources correctly to get the most traffic out of each marketing dollar. The best way to start this is to determine where your site visitors are coming from and a few things you can do with that data to help your brand.
So, the first step you may want to take is to ask yourself “Is traffic coming from where I want it to come from?”. If it isn’t then it’s time to focus marketing efforts on correcting that.